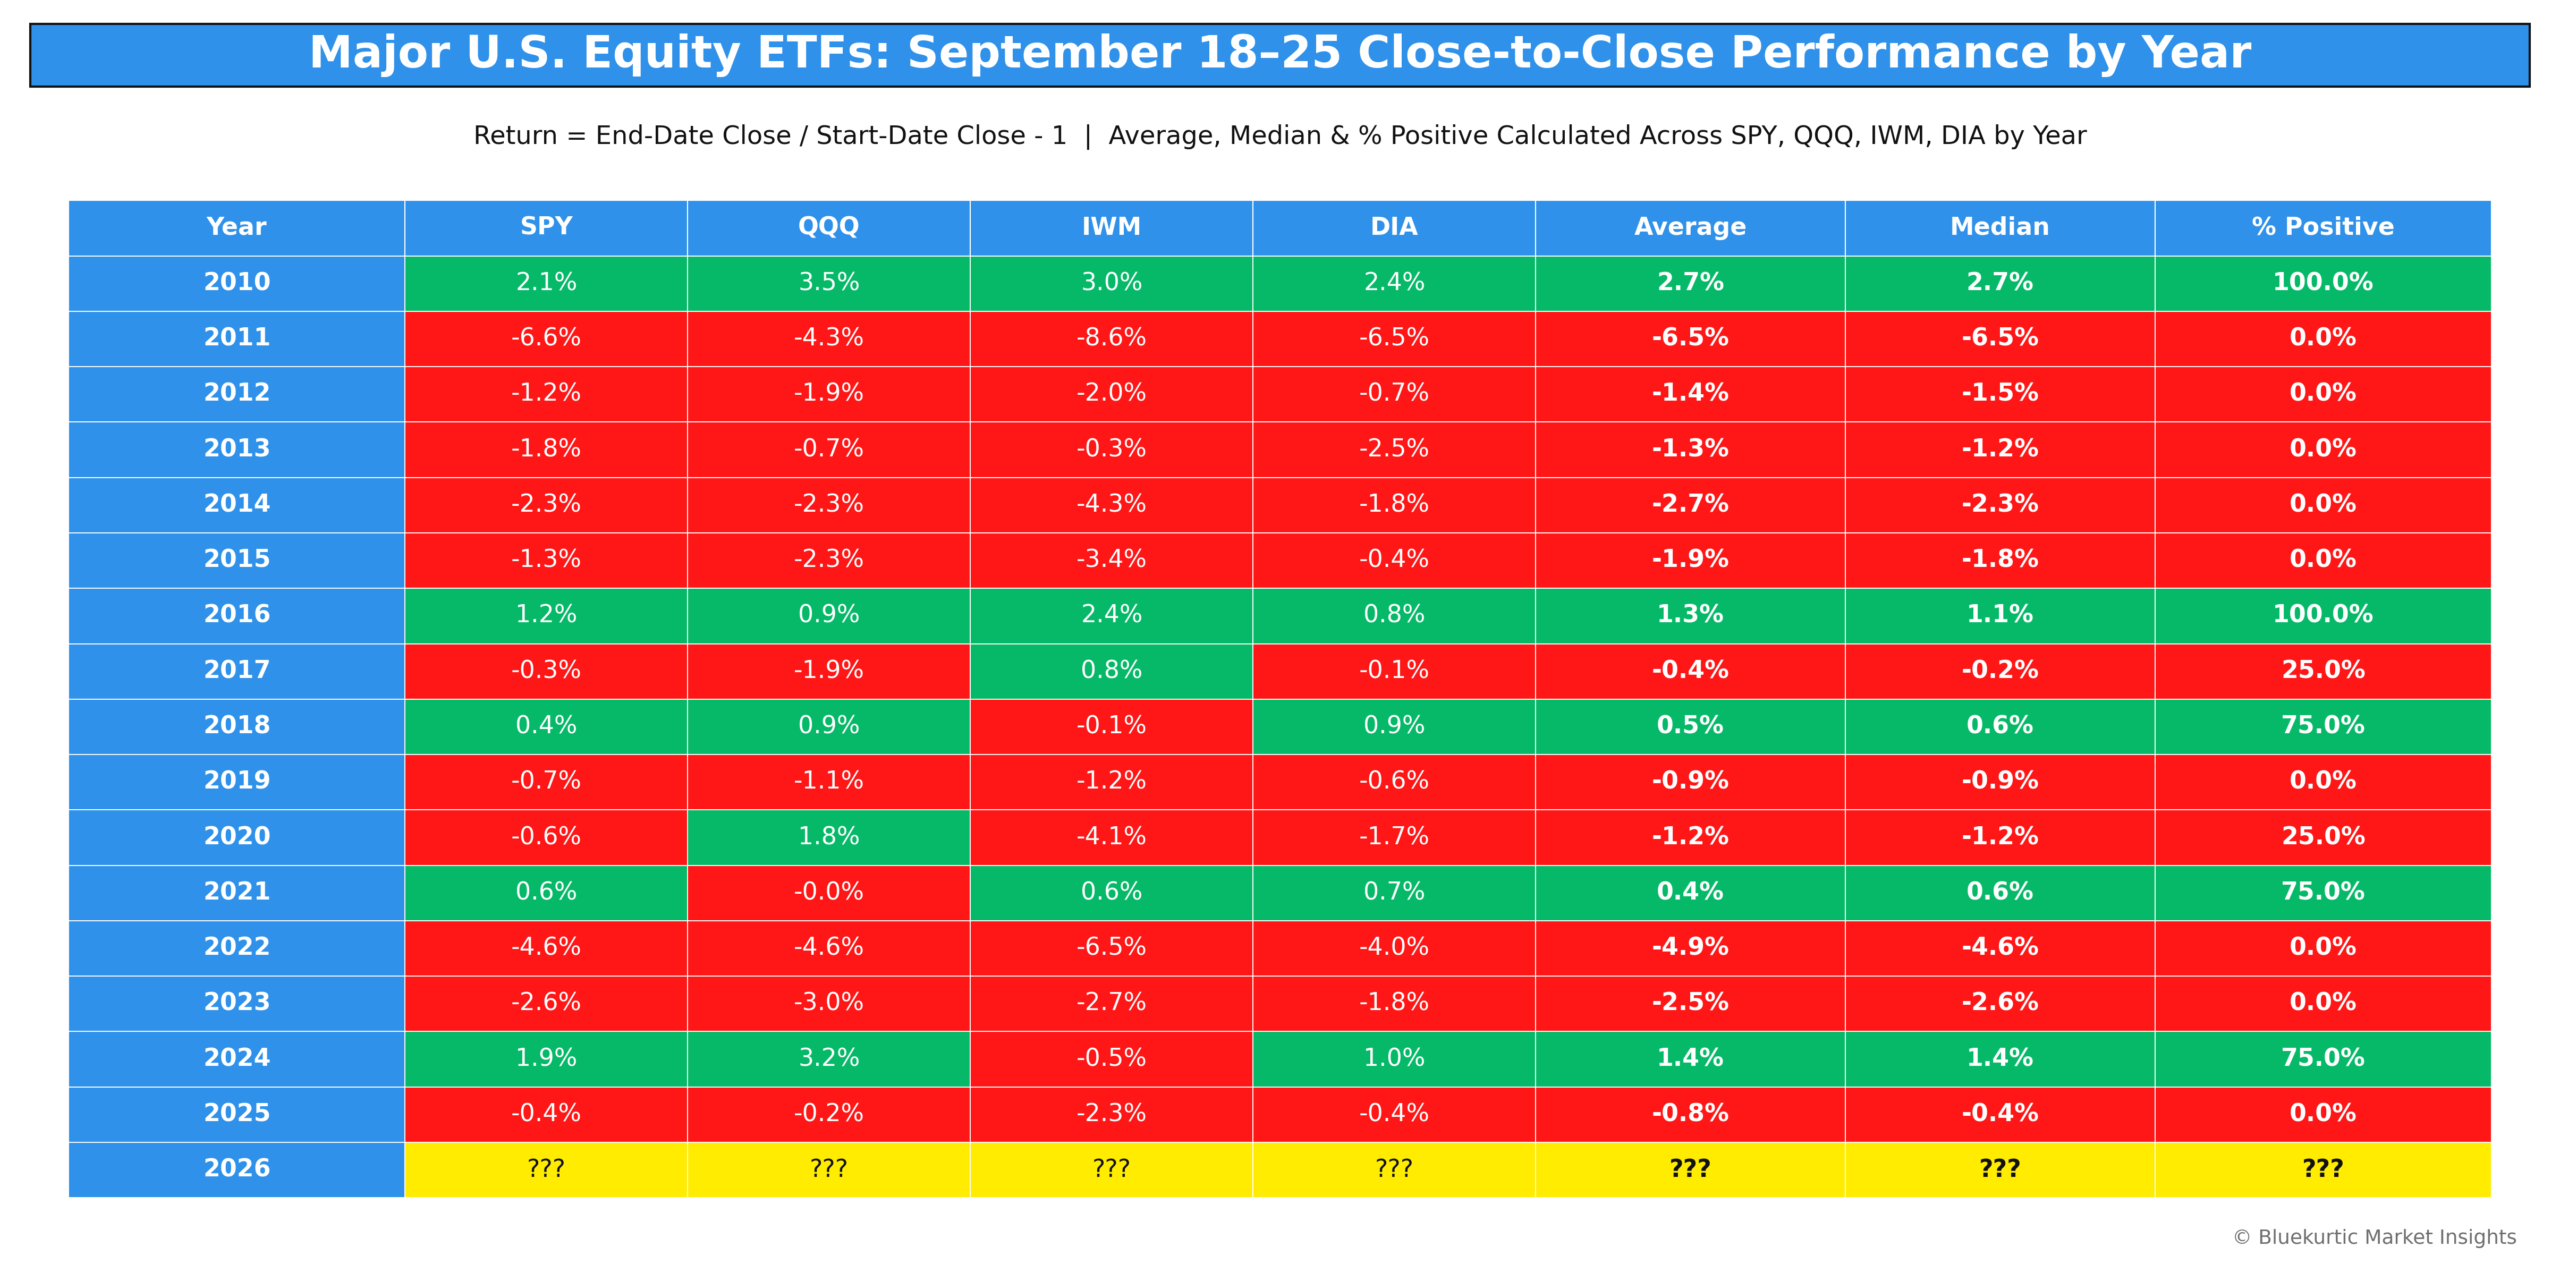
Here is a list of all current S&P 500 stocks and their performance on September 18 to September 25 for every year with available historical data. Returns are calculated using the closing prices on the mentioned start and end dates. If the market is closed on any date, the closing price from the prior trading day is used. The attached screenshot highlights the qualifying stocks from the Excel workbook’s Overview sheet.
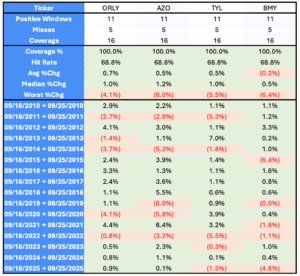
You can find the complete dataset in the Excel sheet here:
sp500_positive_between_dates_close_to_close_client_ready
Note: This stock list is published every week, regardless of whether we identify stocks that meet our highest conviction standards. The objective is to highlight stocks with the strongest historical positivity rate for that specific calendar date. It is intended as a supporting research tool for active traders and should not be interpreted as a recommendation to buy or sell any security.
The portfolio’s average historical performance is provided solely for reference to illustrate how the group has performed collectively on that date in the past. Historical performance does not guarantee future results, and not every day’s list represents a high-conviction opportunity. Please conduct your own research before making any investment decisions.
For investors seeking our highest-conviction ideas, Premium Plus members receive access to our Berry Picks model portfolio under the Model Portfolio section. Berry Picks are selected from more than 30 proprietary research themes, with preference given to stocks that consistently appear across the greatest number of themes.
None of the stocks listed constitute investment advice.
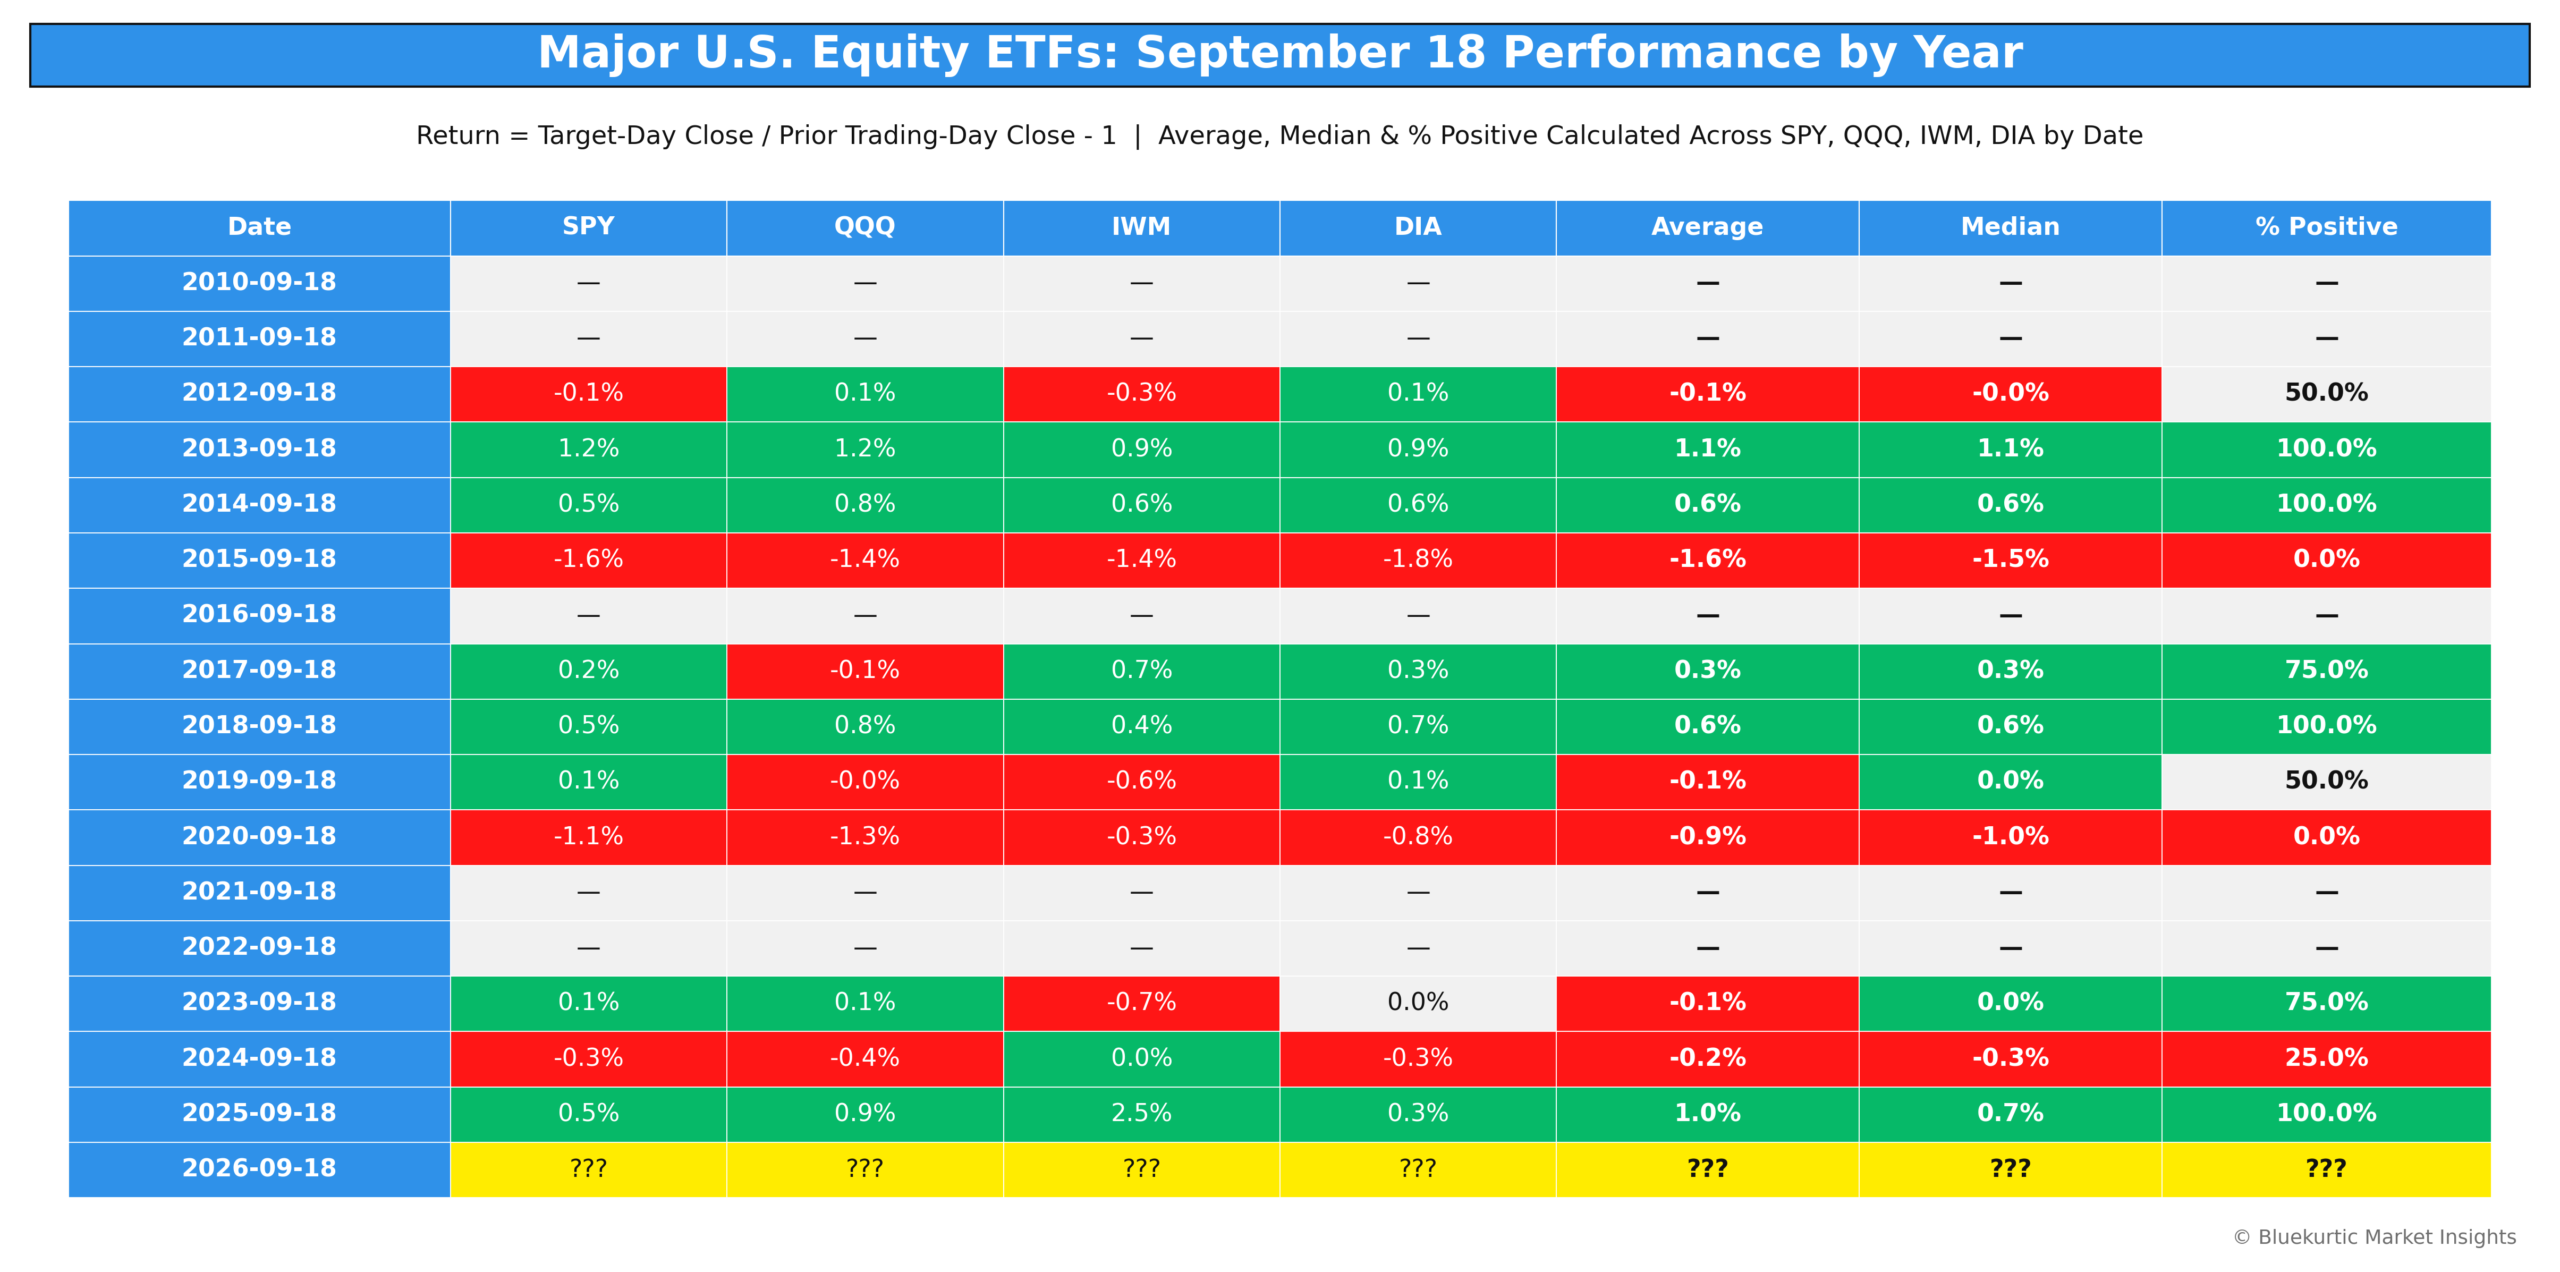
Here is a complete list of current S&P 500 stocks and their historical performance on September 18 for every year since 2010 with available data. The attached screenshot highlights the qualifying stocks from the Excel workbook’s Overview sheet.
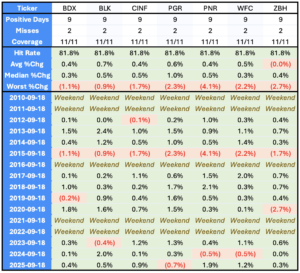
The full dataset, including all stocks currently within the S&P 500 index and historical observations, is available in the Excel file linked below.
sp500_positive_on_given_days_exact_only
Note: This stock list is published every trading day, regardless of whether we identify stocks that meet our highest conviction standards. The objective is to highlight stocks with the strongest historical positivity rate for that specific calendar date. It is intended as a supporting research tool for active traders and should not be interpreted as a recommendation to buy or sell any security.
The portfolio’s average historical performance is provided solely for reference to illustrate how the group has performed collectively on that date in the past. Historical performance does not guarantee future results, and not every day’s list represents a high-conviction opportunity. Please conduct your own research before making any investment decisions.
For investors seeking our highest-conviction ideas, Premium Plus members receive access to our Berry Picks model portfolio under the Model Portfolio section. Berry Picks are selected from more than 30 proprietary research themes, with preference given to stocks that consistently appear across the greatest number of themes.
None of the stocks listed constitute investment advice.
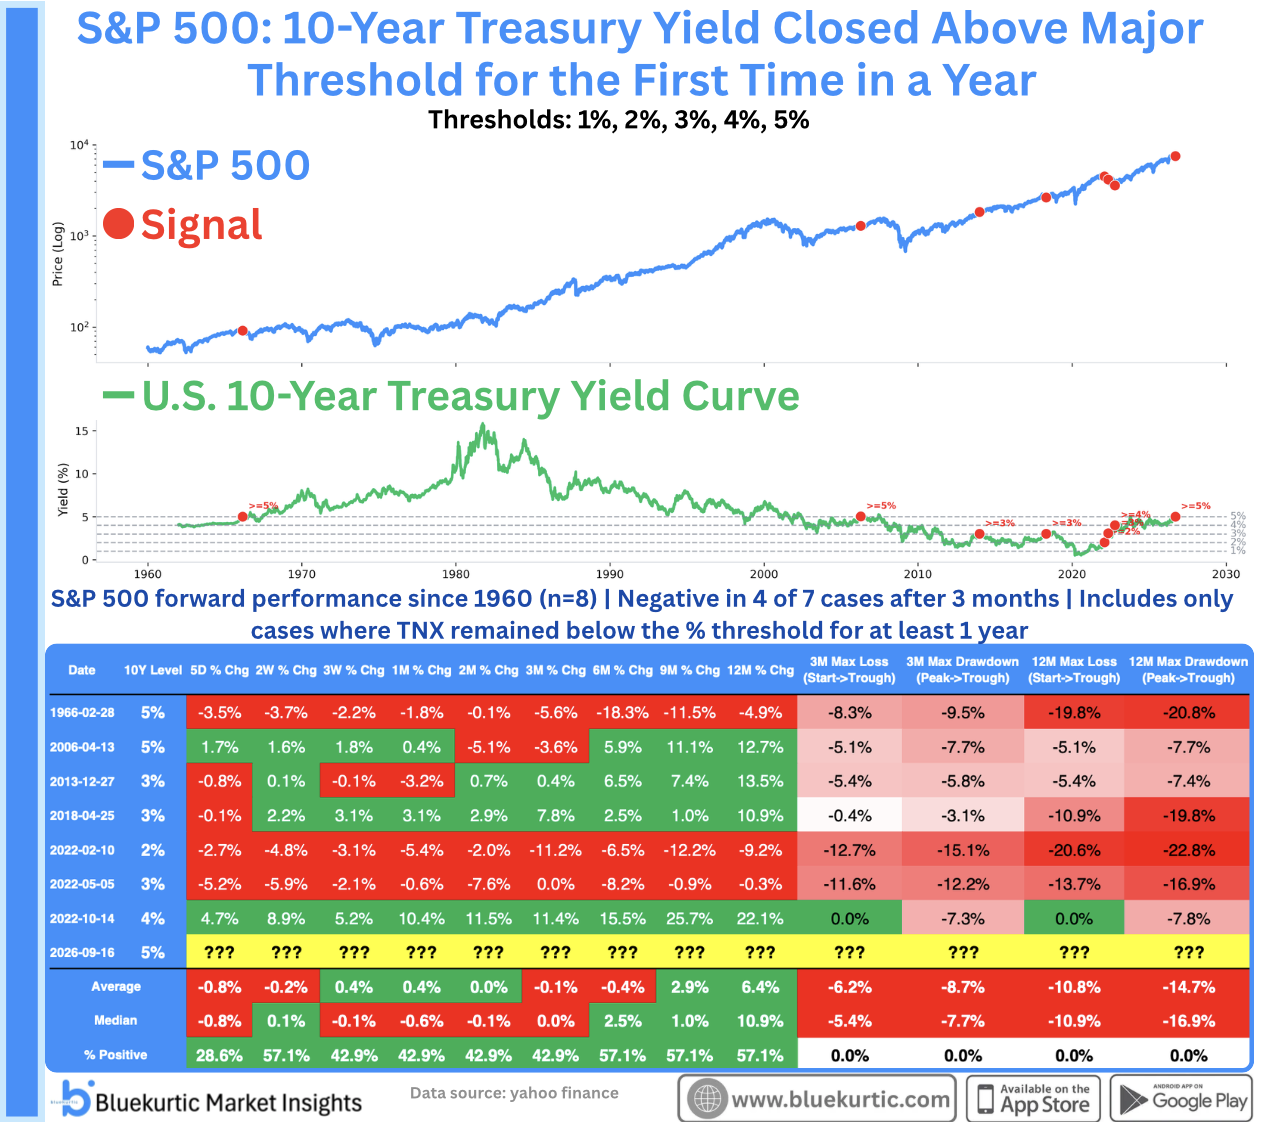
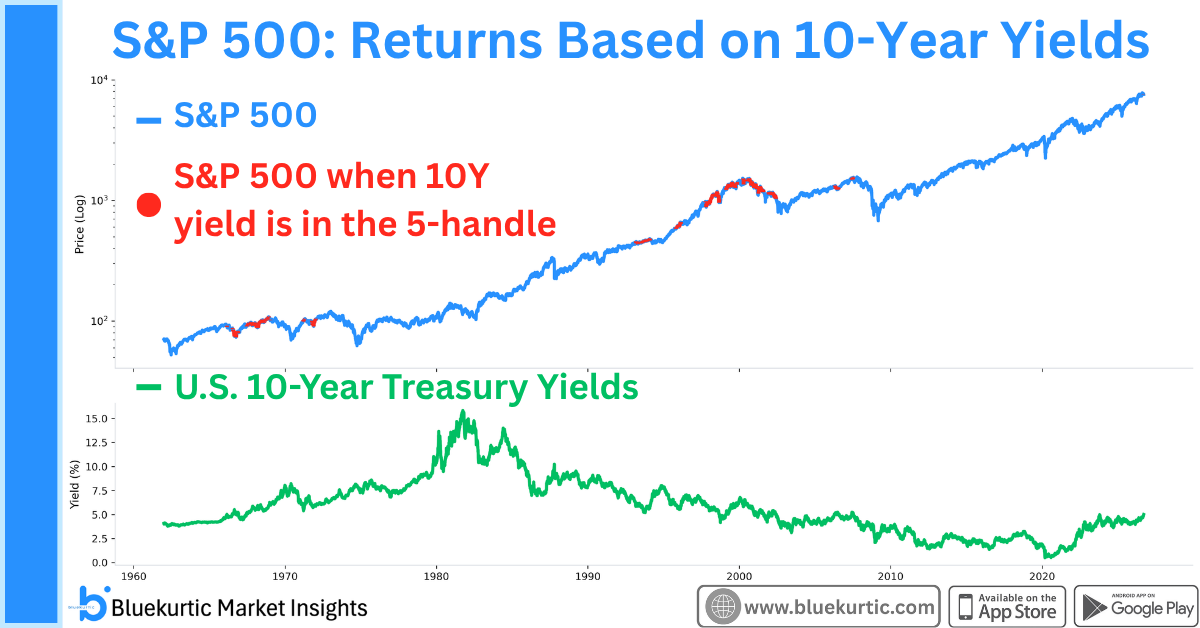
The U.S. 10-year Treasury yield is back in the 5% handle, a level that has historically coincided with a more challenging backdrop for equities.
Looking at S&P 500 performance across different 10-year yield regimes, the 5% handle stands out. Among yield handles from 0% through 10%, it has produced the lowest average S&P 500 forward return over 3, 6, 9 and 12 months. The 3- and 6-month positivity rates are also the lowest of those regimes.
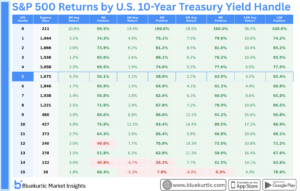
A 5% risk-free yield raises the discount rate applied to future corporate cash flows, increases the hurdle rate for capital deployment and gives investors a materially more competitive alternative to equities. That can compress valuation multiples even when underlying earnings remain resilient.
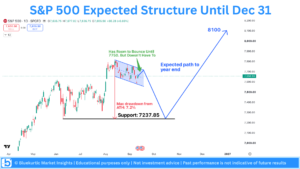
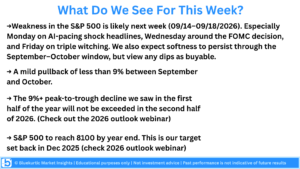
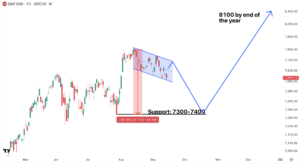
This does not imply that stocks cannot advance from here, nor does it alter a longer-term bullish thesis by itself. We think this aligns with our base case of weakness in September with a possibility of extending into October. We still see S&P 500 making new highs and reaching 8100 by year end. We think the level of 7300-7400 could provide a good support for the S&P 500.
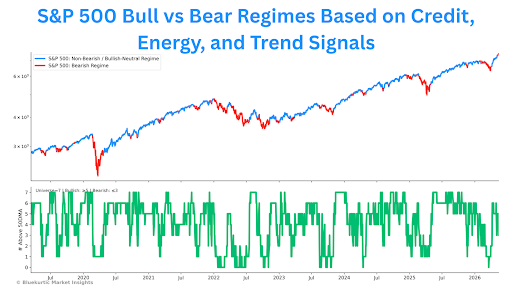
Credit to Bespoke Investment Group for the original regime framework this analysis is built on.

This week’s Market Insight Clip breaks down two major stories:
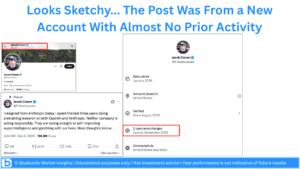
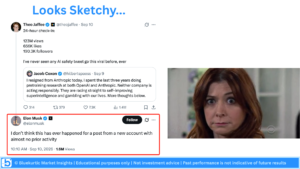
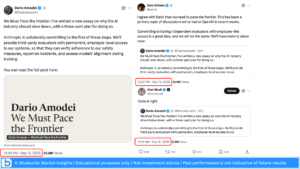
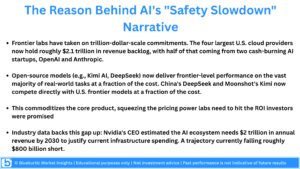
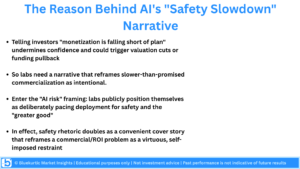
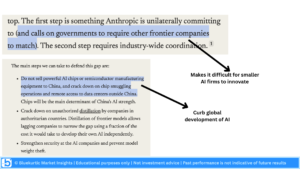
The AI Pacing Story: Dario Amodei’s call to “slow down the frontier” sparked a wave of CEO agreement from Elon Musk and Sam Altman. We dig into the suspicious timing and the account that started it all, and lay out why we think this narrative may be less about safety and more about trillion-dollar monetization pressure, open-source competition (Kimi AI, DeepSeek), and Treasury yield dynamics.
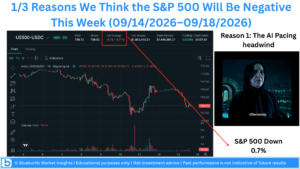
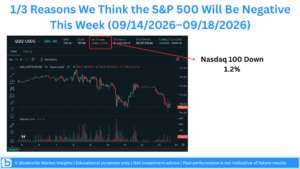
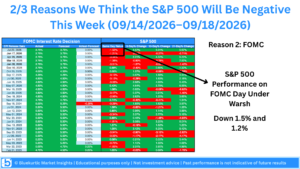
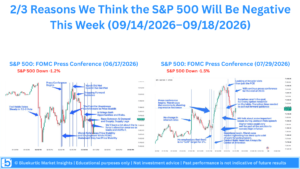
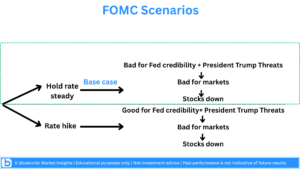
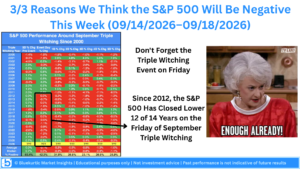
S&P 500 Weekly Outlook (09/14–09/18/2026): 3 reasons we expect a negative week:
- AI-pacing shock headlines (Monday)
- FOMC decision under Fed Chair Warsh (Wednesday)
- September triple witching (Friday) — S&P 500 has closed lower 12 of the last 14 years on this day
We also cover our expected S&P 500 structure through year-end, key support/resistance levels, and our 8,100 year-end target (set December 2025).