Charts on the Street is our effort to go beyond Bluekurtic’s own research and highlight insights from across the investment community. Each day, we curate charts from analysts, strategists, researchers, and institutions that are publicly available and we believe are worth reviewing.
The inclusion of a chart does not imply that Bluekurtic agrees with its conclusions, forecasts, or investment views. Our goal is to present a broad range of perspectives and research that may help investors better understand the market environment. These charts are not produced by Bluekurtic, and full credit belongs to their original authors.
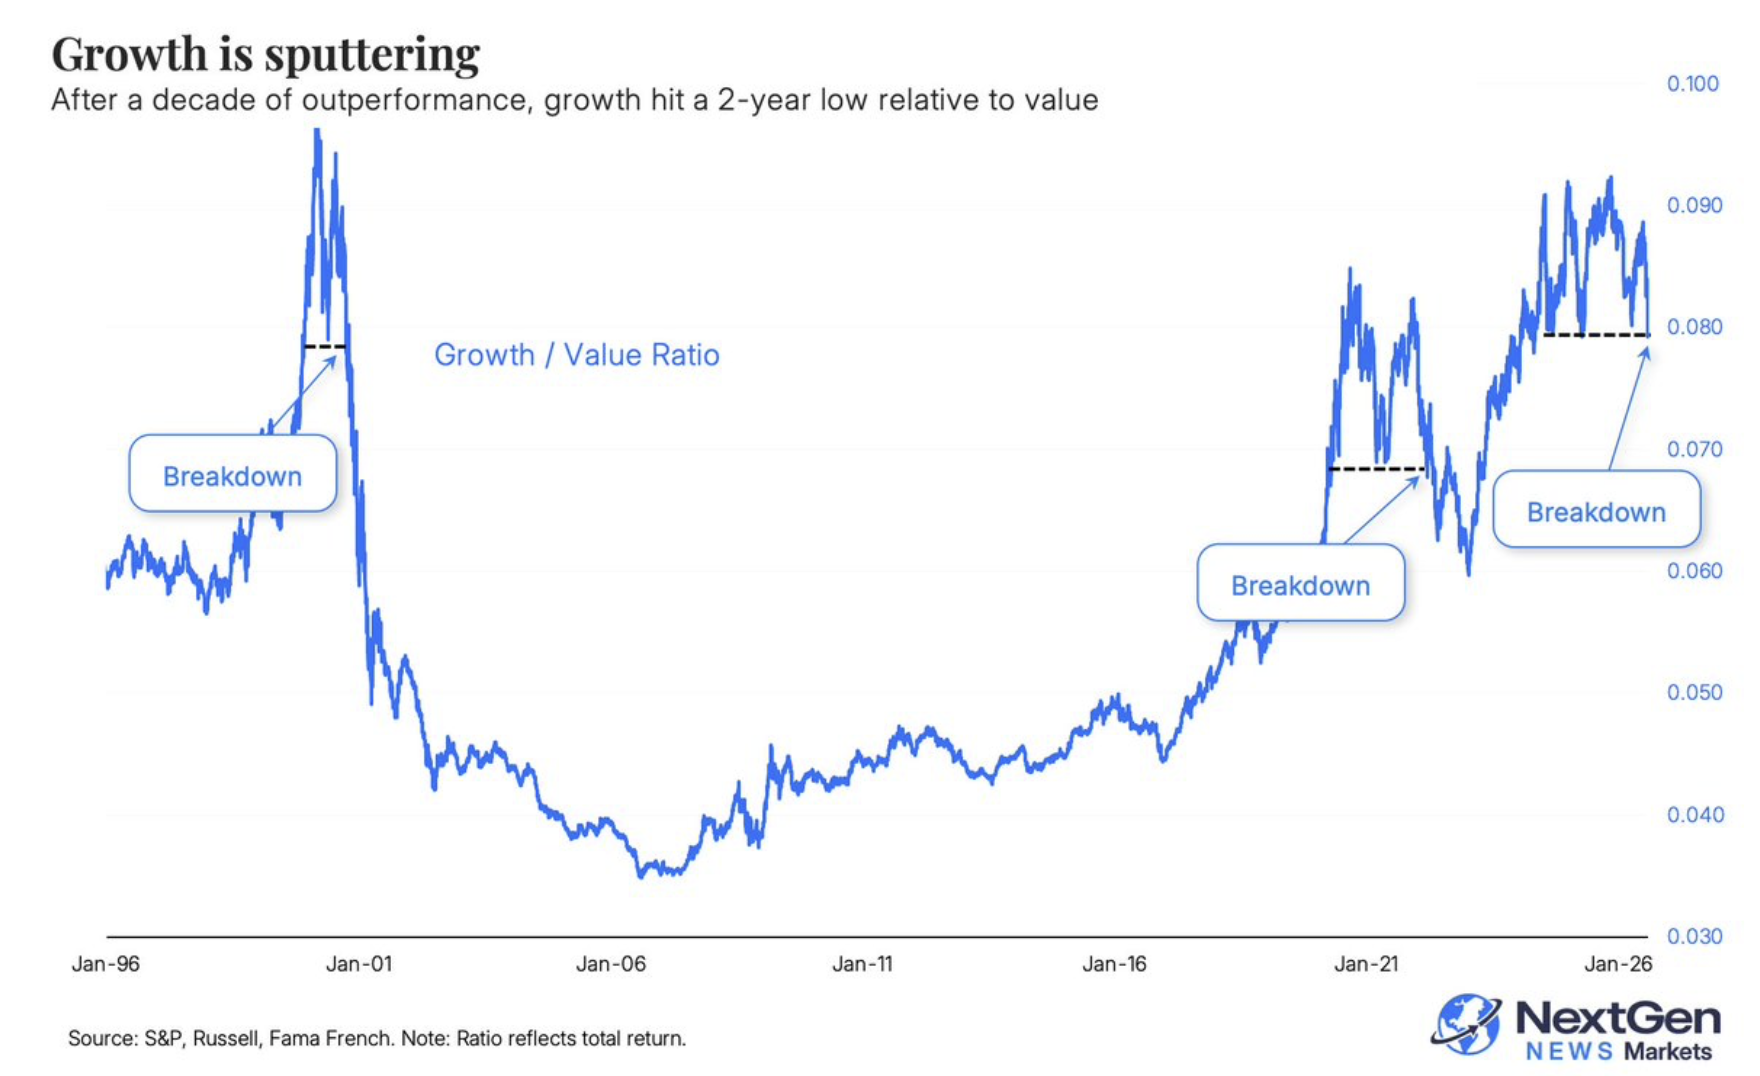
1 – @jasongoepfert: A 2-year breakdown in growth vs. value. The last two major breakdowns preceded some tough markets.

2 – @RenMacLLC: Higher mortgage rates have taken a bite out of purchase loan demand. Mortgage loan applications for purchase fell 3.6% for the week ending July 24, the 3rd decline in the last 4 weeks. Broader story is that purchase demand has been flat since the middle of last year.

3 – @GlobalMktObserv: Hedge funds are aggressively cutting risk across the AI trade: Hedge funds sold global memory chip stocks over the 2 trading days through Monday, extending Friday’s selloff and marking the largest 2-day outflow from the sector in at least 2 years. Overall, hedge funds saw their largest reduction in gross exposure on Monday since September 2025, a historically extreme move driven primarily by cuts to single-stock positions. Single-stock exposure alone saw its biggest reduction since March 2025, led by Information Technology names tied to the AI and momentum trades. In total, hedge funds reduced gross exposure across every sector except Energy, and across all regions. Hedge funds are abandoning the AI trade at a record pace.

4 – @Marlin_Capital: CTAs haven’t even started selling yet. If the $SPX starts to roll over, this will become another big headwind for stocks.

5 – @EricBalchunas: I’M NOT LEAVING: Since $SMH began its 20% decline a month ago (with every single stock now trading below its 50d avg), semi and AI ETFs have taken in $25 billion in net inflows, with positive flows on 55% of trading days. Good note on this from @psarofagis today

6 – @DavidCohne: In our Ebb & Flow for June via @FrancisSharoon, mutual funds only lost $23.3 billion as investors favored defensive categories, adding $41 billion to money-market funds and $24 billion into bond funds.

7 – @jukan05: Finally, some welcome news. In a report published today, JPMorgan said that most leveraged ETFs in the Korean stock market have been liquidated and estimated that hedge funds’ deleveraging is also about 90% complete.

8 – @zerohedge: Crude -7.167MM, Exp. +1.00MM Gasoline +7K Distillates +1.062MM Cushing -771K Production -2kb/s to 13.796MM SPR -5.057MM to 307.650MM All reserves will hit a brick wall at the same time.

9 – @TimmerFidelity: The expected rate hikes (now 48 bps) are keeping the US dollar bid. The dollar index has not moved much for over a year, but a chartist might look at that range and see a large base brewing.

10 – @VolSignals: Market makers just closed a 3rd straight session with a position < $1B of SPX gamma the 6th time since July 2024. Every prior time, the S&P closed 5%+ away from the trigger inside a month. Median biggest move: 8.9% (vs a normal month of 3.6%)

11 – @neilsethinew: BBG: The Mag-7 is near a record low valuation relative to the SPX.

12 – @KevRGordon: Piper Sandler: “…reduced tariffs and IEEPA refunds will have provided a $180 billion windfall to importers (0.6% of GDP). However, this substantially expands budget deficit without providing meaningful stimulus to the economy.”

13 – @GinaMartinAdams: Bond markets are throwing cold water on the outlook for stocks. Real yields (10-year Treasury yields adjusted for inflation) are now at the highest level since late 2023. As a result, stocks’ equity risk premium (ERP) is now lower than 75% of history since 1980. This range for the ERP has historically hinted at a volatile and slower return backdrop for stocks, helping to explain the choppiness in markets of late. Currently, the S&P 500 carries an earnings yield – the inverse of the trailing price/earnings ratio – of 3.67%. In absolute terms, that’s cheaper than the 3.4% commanded by the index in May, as strong earnings have largely offset stock price gains. However, thanks to rising TIPS yields, real yields have climbed to 2.4% — the highest level since fall 2023. Thus, equities now look extremely expensive compared to bonds. The 123-bps spread between the earnings yield and the 10-year TIPS yield is the narrowest since the tech bubble and is in the fourth (lowest) quartile of the last half-century. As we noted in Market Sense in May, not all low ERP regimes portend bad times for stocks, but average returns tend to be lower when stocks are so expensive relative to bonds. When the ERP was near current levels historically (in the 4th quintile), 6- and 12-month forward S&P 500 returns were below long-term average, at median 2.6% and 6%, respectively.

14 – @GroupFinom: Tech’s buybacks have been flat over the past year. Investors will be looking for changes to Microsoft’s $MSFT buyback plans in this week’s earnings report Where have the big-Tech buybacks gone? Hyperscalers have been using those funds to transfer to $NVDA for the AI buildout!

15 – @KevRGordon: From @VandaTrack: “Retail sold a net $243m of single stocks yesterday, marking the largest one-day outflow since the Covid crash.”

16 – @schaeffers: Investors are rotating into value at the fastest pace since the Global Financial Crisis as momentum trades unwind. The shift has favored healthcare and financials while high-flying AI names cool off.

17 – @schaeffers: The AI trade just suffered its biggest monthly reversal on record, with AI winners lagging AI losers by 42 percentage points. UBS says the move reflects aggressive position unwinding more than a change in the long-term AI story.

18 – @YCCMacro: Housing Is No Longer Carrying U.S. Inflation Alone The composition of underlying U.S. inflation has changed dramatically. During the inflation peak, goods contributed roughly 1.5 percentage points, services excluding housing added around 1.6 points, and housing contributed nearly 1 point, pushing MCT inflation close to 3.8%. As inflation cooled through 2023, all three components weakened together. More recently, however, MCT has rebounded toward 2%, led primarily by firmer goods inflation and resilient non-housing services, while housing plays a smaller role than during the post-pandemic surge. That’s a major shift. Inflation persistence is no longer just a shelter story. A broader mix of underlying components is keeping price pressures elevated, reinforcing why policymakers are increasingly focused on structural inflation measures rather than headline data alone.

19 – @YCCMacro: The U.S. Market’s “TACO” Trade Is Back The U.S. market has increasingly become a headline-driven machine. YCC Capital’s TACO Index—tracking Trump Anxiety & Complacency—has surged again as tariff announcements, Middle East tensions, ceasefire negotiations, and geopolitical shocks repeatedly swing risk sentiment. The index spiked above 2.5 during the tariff escalation, collapsed into negative territory following ceasefire developments, then rebounded after renewed Israel-related tensions. The biggest contributors include U.S. equities, oil prices, CPI swaps, bond markets, and broader financial conditions. Markets are rapidly rotating between panic and relief rather than trading on long-term fundamentals. For investors, political risk has become a core macro factor influencing Treasury yields, inflation expectations, energy prices, and equity volatility across the United States.

20 – @Marcomadness2: The Mag7 risks


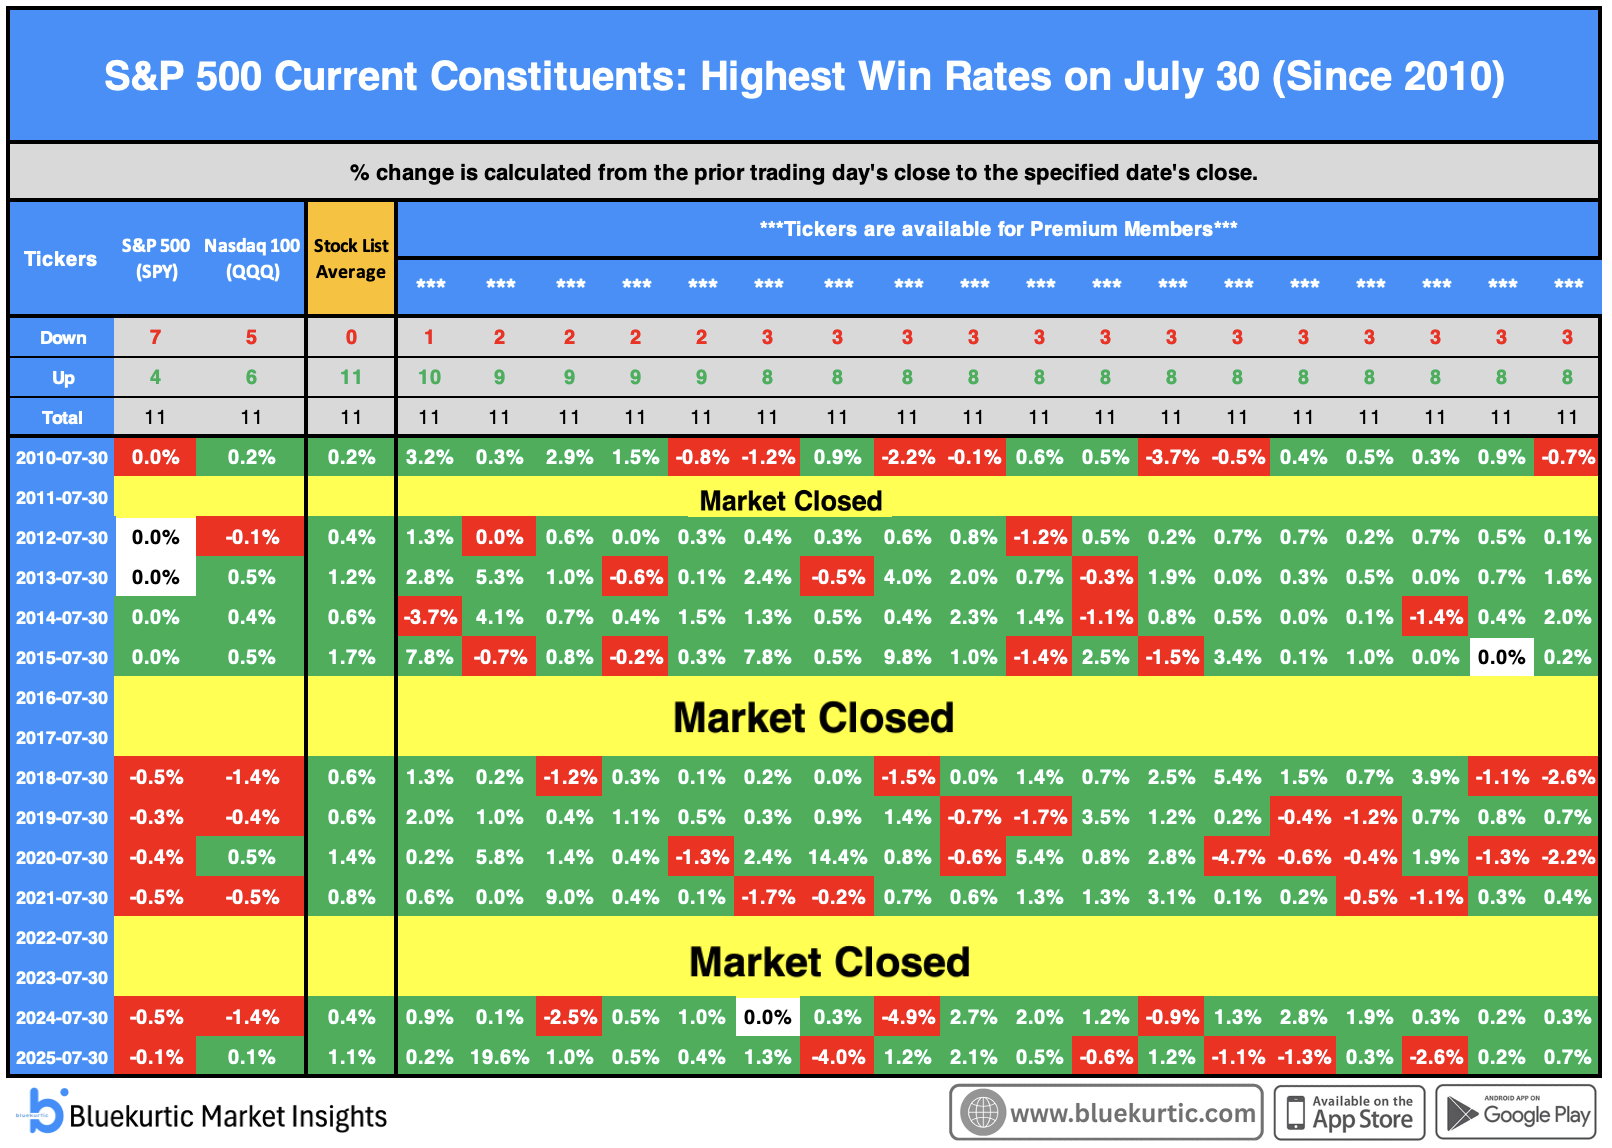
Since 2010, 18 stocks have been positive on at least 8 of 11 cases.
An equally weighted portfolio of these stocks has never finished negative since 2010.
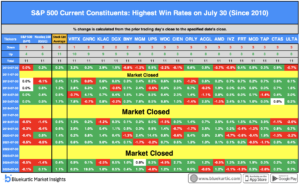
Note: This stock list is published every trading day, regardless of whether we identify stocks that meet our highest conviction standards. The objective is to highlight stocks with the strongest historical positivity rate for that specific calendar date. It is intended as a supporting research tool for active traders and should not be interpreted as a recommendation to buy or sell any security.
The portfolio’s average historical performance is provided solely for reference to illustrate how the group has performed collectively on that date in the past. Historical performance does not guarantee future results, and not every day’s list represents a high-conviction opportunity. Please conduct your own research before making any investment decisions.
For investors seeking our highest-conviction ideas, Premium Plus members receive access to our Berry Picks model portfolio under the Model Portfolio section. Berry Picks are selected from more than 30 proprietary research themes, with preference given to stocks that consistently appear across the greatest number of themes.
None of the stocks listed constitute investment advice.
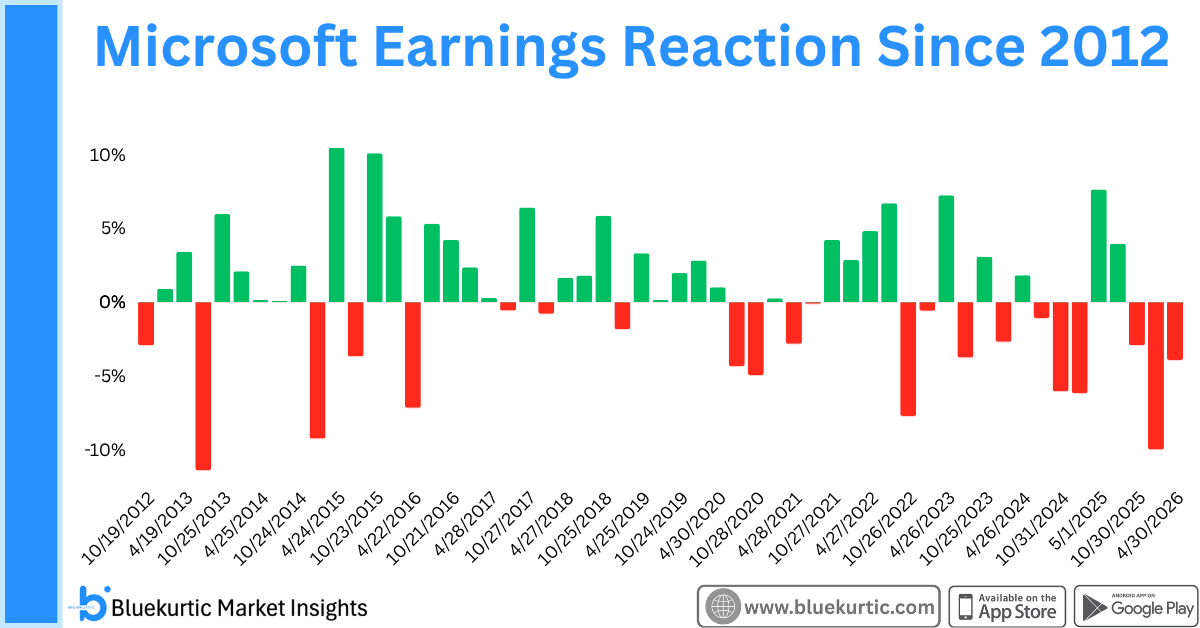
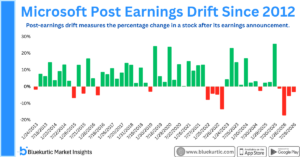
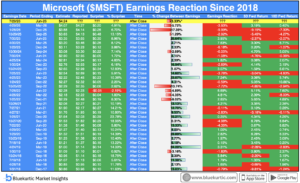
Microsoft reports earnings after the close today, and the setup carries more weight than usual. The stock has now had three straight negative reactions on earnings day and four straight negative post earnings drifts. Going back to at least 2012, Microsoft has never strung together four consecutive negative reactions or five consecutive negative drifts. Today’s report puts both streaks on the line at once.
The timing adds pressure. Microsoft and Meta report on the same day, and both are being watched through the same lens right now, whether the enormous spending behind the AI buildout is actually paying off. That question got sharper last week when Alphabet posted strong numbers across the board but still had its worst trading day in over a year, after investors noticed the company had gone cash flow negative for the first time as a public company because of how much it’s spending on capex. If Alphabet’s results weren’t enough to ease concerns, the bar for Microsoft and Meta may be even higher, since neither is seen as holding quite the same industry standing Alphabet does right now.
Microsoft shares are down 19% this year, one of the worst showings in the Nasdaq 100, which itself is up 10% in 2026. Capital spending including leases is expected to top $42 billion for the fiscal fourth quarter, pushing the full year total to roughly $146.6 billion, nearly double what the company spent the year before. Attention will likely shift quickly to guidance for fiscal 2027, where estimates point to spending north of $230 billion, while adjusted free cash flow is expected to fall to around $32 billion from $62.3 billion this year. Azure revenue growth is projected near 40%, a strong number on its own, though Alphabet’s cloud business grew more than 80% last quarter and that still wasn’t enough to satisfy investors. Analysts are still looking for double digit revenue and earnings growth from Microsoft, and on valuation the stock trades under 20 times forward earnings, below both its own 10 year average and the broader Nasdaq 100 multiple.
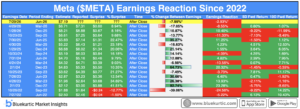
Meta’s setup looks tougher on the cash side. The company is expected to spend $135.6 billion in capex this year and more than $175 billion next year, funded partly through debt issuance and reportedly a possible stock offering. Free cash flow is expected to fall below $1 billion in 2026, down sharply from $46 billion last year, and could turn negative in 2027 before recovering in 2028. Unlike its AI spending peers, Meta doesn’t have a cloud business to sell excess computing capacity through yet, though it’s reportedly building one and in talks to lease capacity to outside partners.
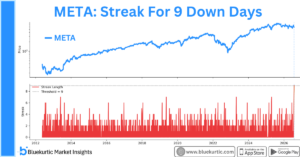
Between the two, Microsoft walks into today’s print carrying the more unusual streak. A fourth straight negative reaction or a fifth straight negative drift would both be firsts for the stock since at least 2012. A break in either streak would say something too. Not to forget, Meta stock is now down 9 straight days. This number is a record since the stock started trading. Either way, today marks a real inflection point for how the market is pricing AI spending across mega cap tech.

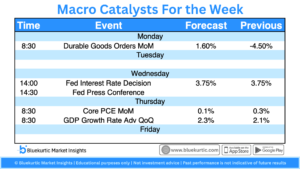
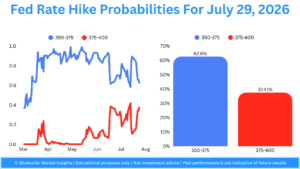
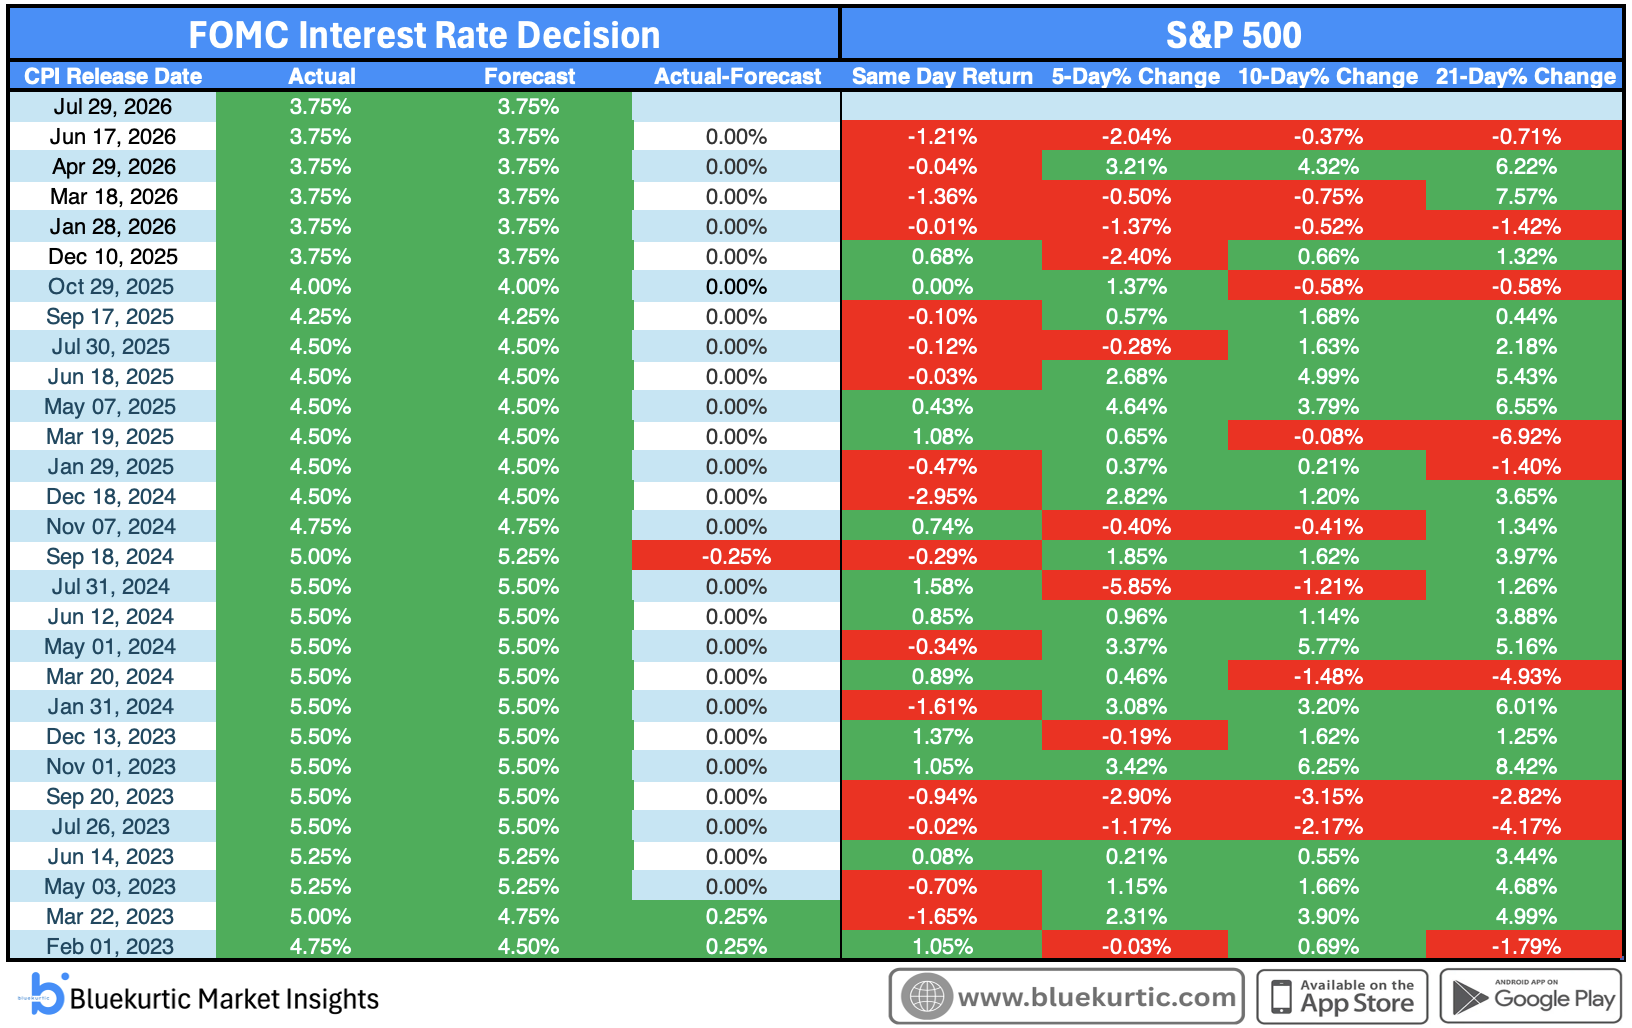
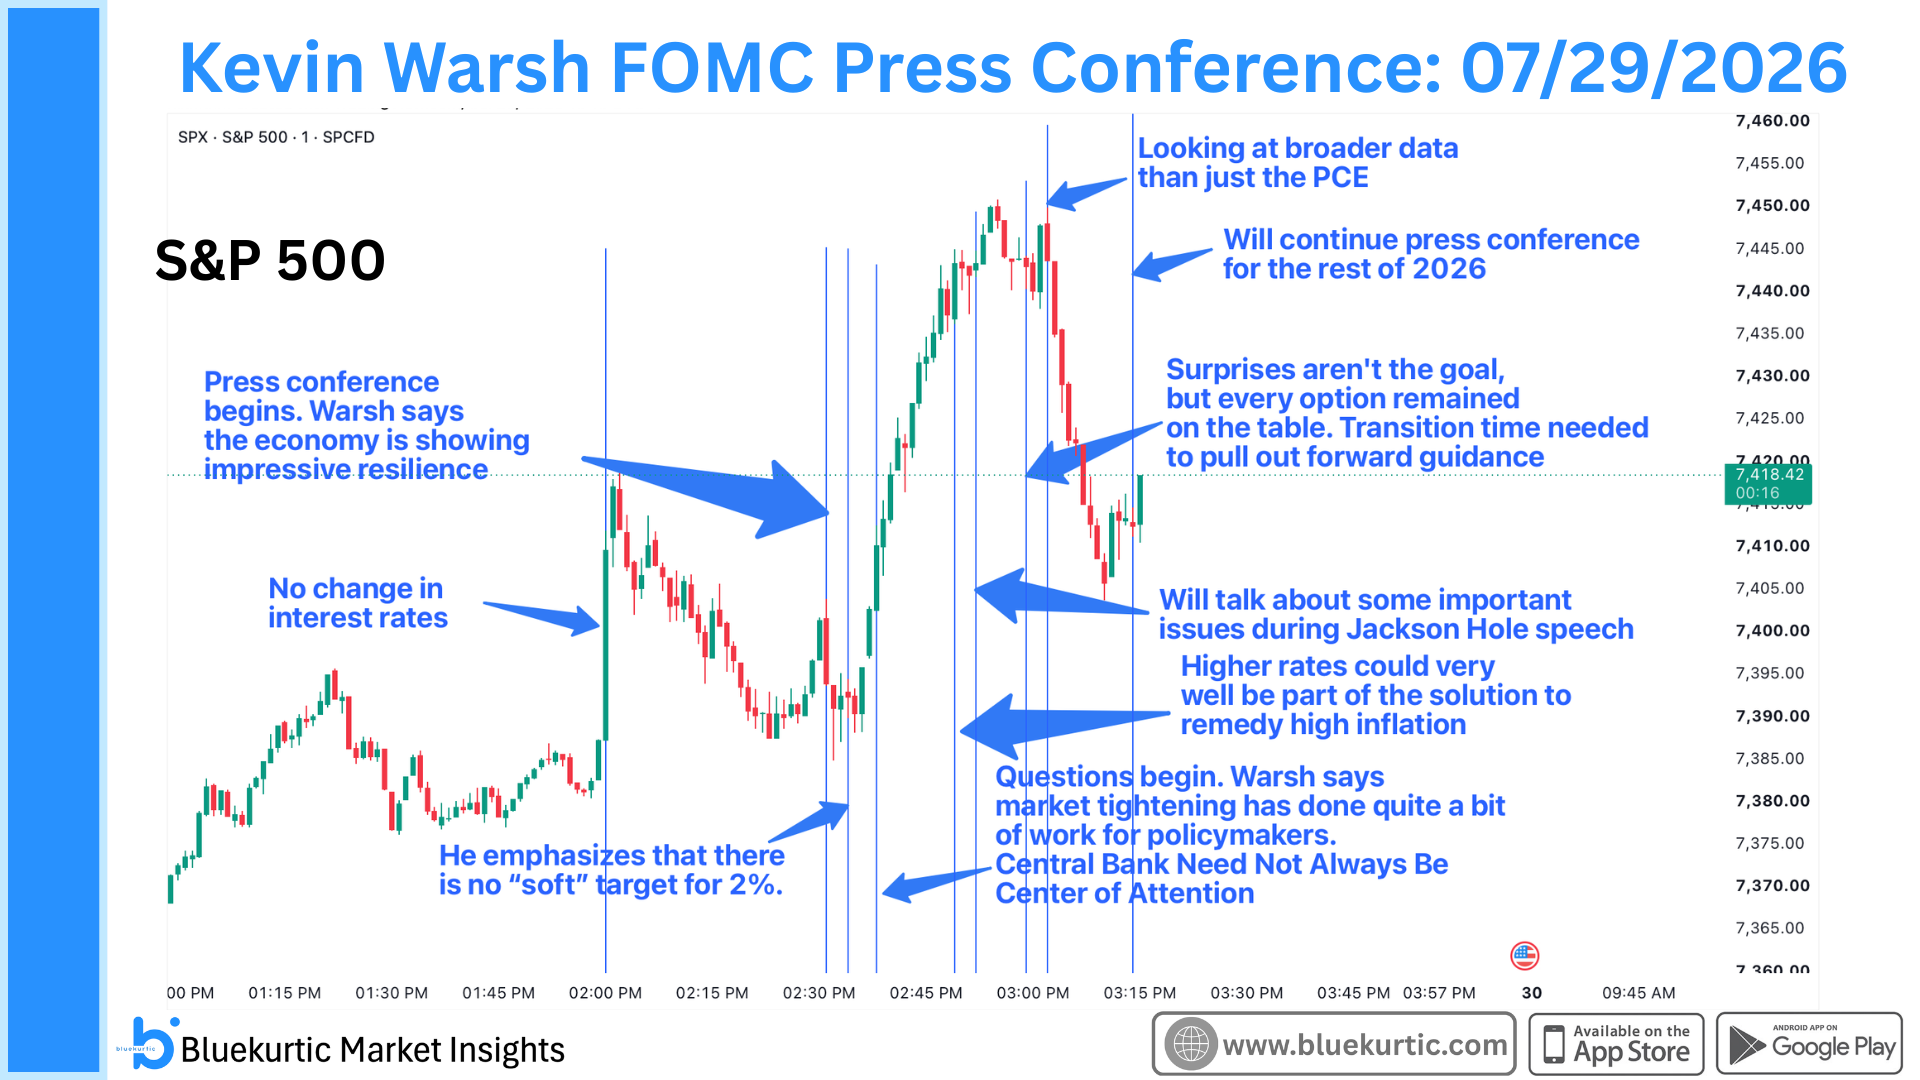
This week brings the biggest macro and earnings catalysts of the month. The Fed’s rate decision lands Wednesday at 2:00 PM, with Kevin Warsh’s press conference following at 2:30 PM and markets are pricing in unusually high uncertainty, with over a 37% chance of a hike priced in.
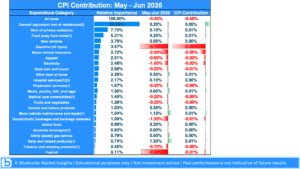
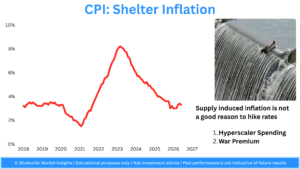
We break down why we think that’s too hawkish: shelter inflation (nearly 30% of CPI) has been cooling steadily since 2023, and the two biggest drivers pushing inflation higher right now: hyperscaler AI spending and the war-related oil premium aren’t the kind of inflation a rate hike actually fixes.
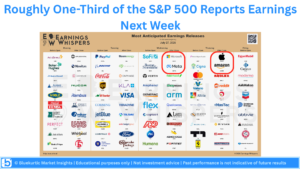
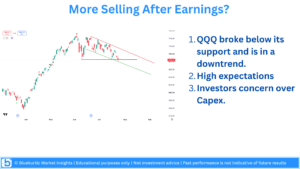
On earnings: roughly a third of the S&P 500 reports this week, headlined by Microsoft and Meta (Wednesday) and Apple and Amazon (Thursday). With QQQ breaking below key support and capex scrutiny rising post-Google, we lay out why the setup into these prints looks shaky even as our longer-term view on these names stays constructive.